A Performance Review of GitHub Actions - the cost of slow hardware
10/23/2021
•5 minute readIt is relatively common to accept a slow CI speed. If speed is recognized as an issue, the solution is often caching and trying to parallelize tests that do not need to run sequentially. This reduces the CI run time marginally, at most, with a cost/value proposition that is not so convincing. Most of the time, developers live with slow CI's - they accept it as a constant that can not be easily be changed in a meaningful way.
We think that developers should not have to accept slow CI's, and we believe that we have the solution to this. Before that, let's talk about the cost of slow hardware.
A Performance review
In this performance review, we will take a close look at the cost of slow hardware. Firstly, we will compare CI runs with different codebases, on different hardware. We will then explain the different CI runs, by delving into characteristics of the respective codebase, programming language, and the available CI hardware.
Hardware
For the tests, we will go with 5 different hardware setups from these three systems:
- GitHub Actions - the only runner provided by GitHub Actions, a 2vCPU machine.
- MacBook Pro 2015 - i7 4 cores/16GB, which runs on GitHub's official self-hosted runner software, actions-runner. We virtualize Ubuntu 20.04 on it, mainly due to the dependency requirements of most CI workflows.
- 3 BuildJet runners - BuildJet supports up to 64vCPU, but for this review, we will only use BuildJet's 2vCPU, 4vCPU, and 8vCPU high-performance runners.
Software
We have chosen three codebases that we think cast a wide net. Each project runs mainly in a different language, representing a different type of codebase, with different types of characteristics.
- Facebook's Folly - Core C++14 library components used extensively at Facebook
- Nextcloud's bookmarks - Web app written in PHP and javascript
- Rust’s regex library - A high-performance regex lib in rust
Facebook’s Folly
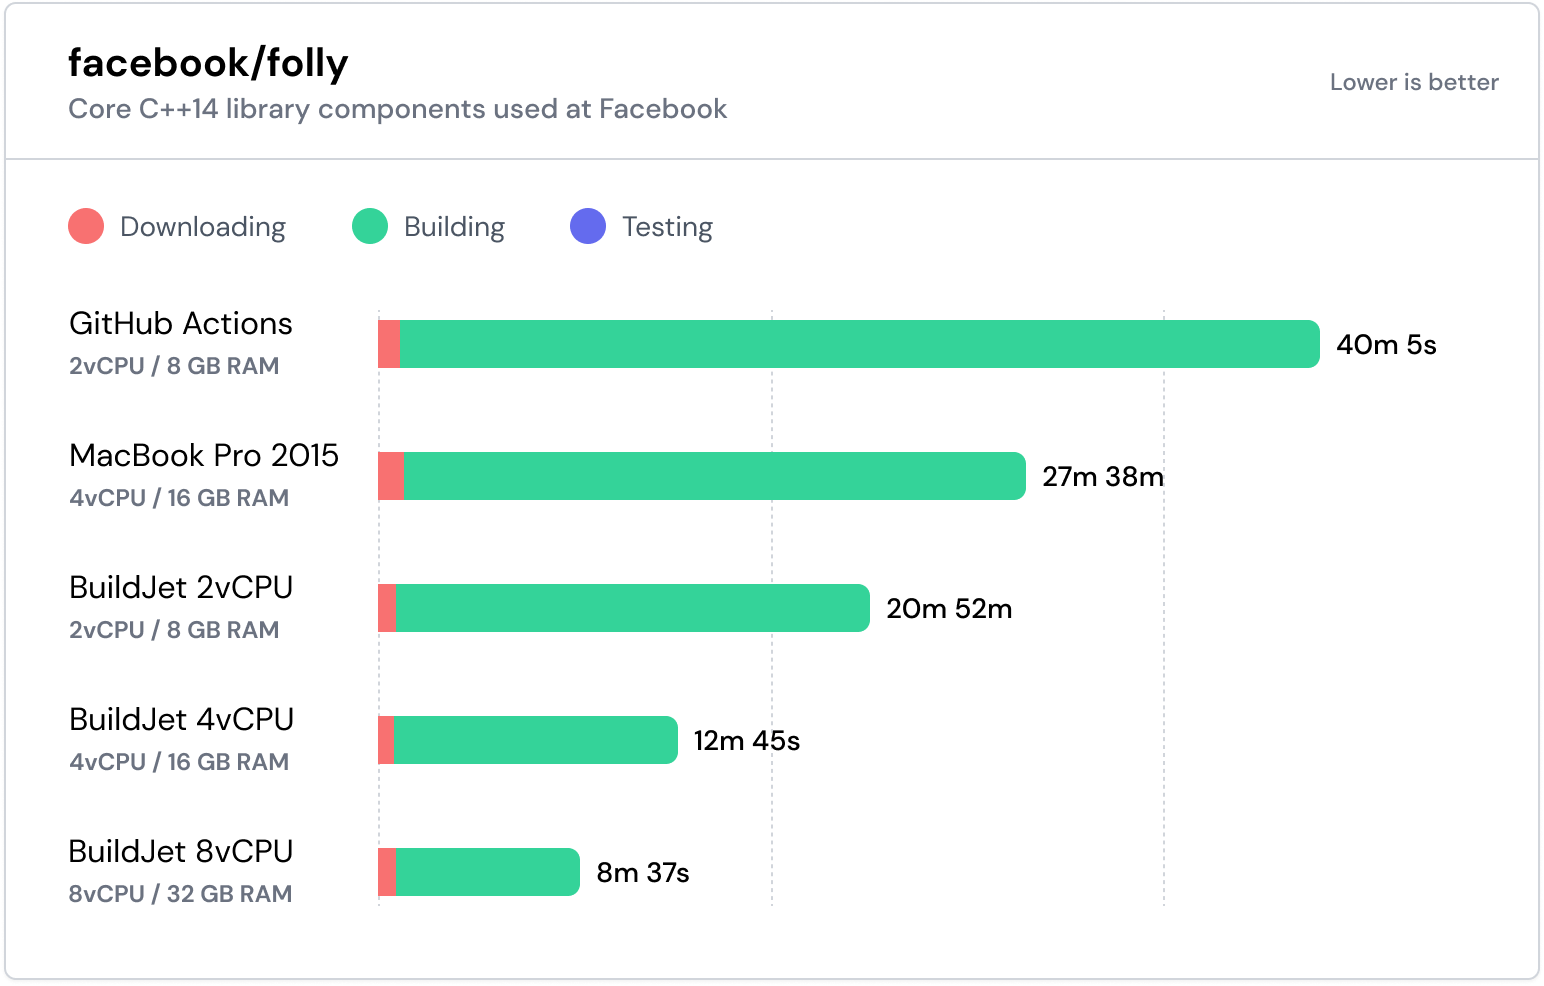
Main takeaways:
- A MacBook Pro from 2015 beats the GitHub Actions hardware
- This is a clear example of a project that can utilize more available cores
For more details check out the GitHub Actions CI run page.
NextCloud Bookmarks
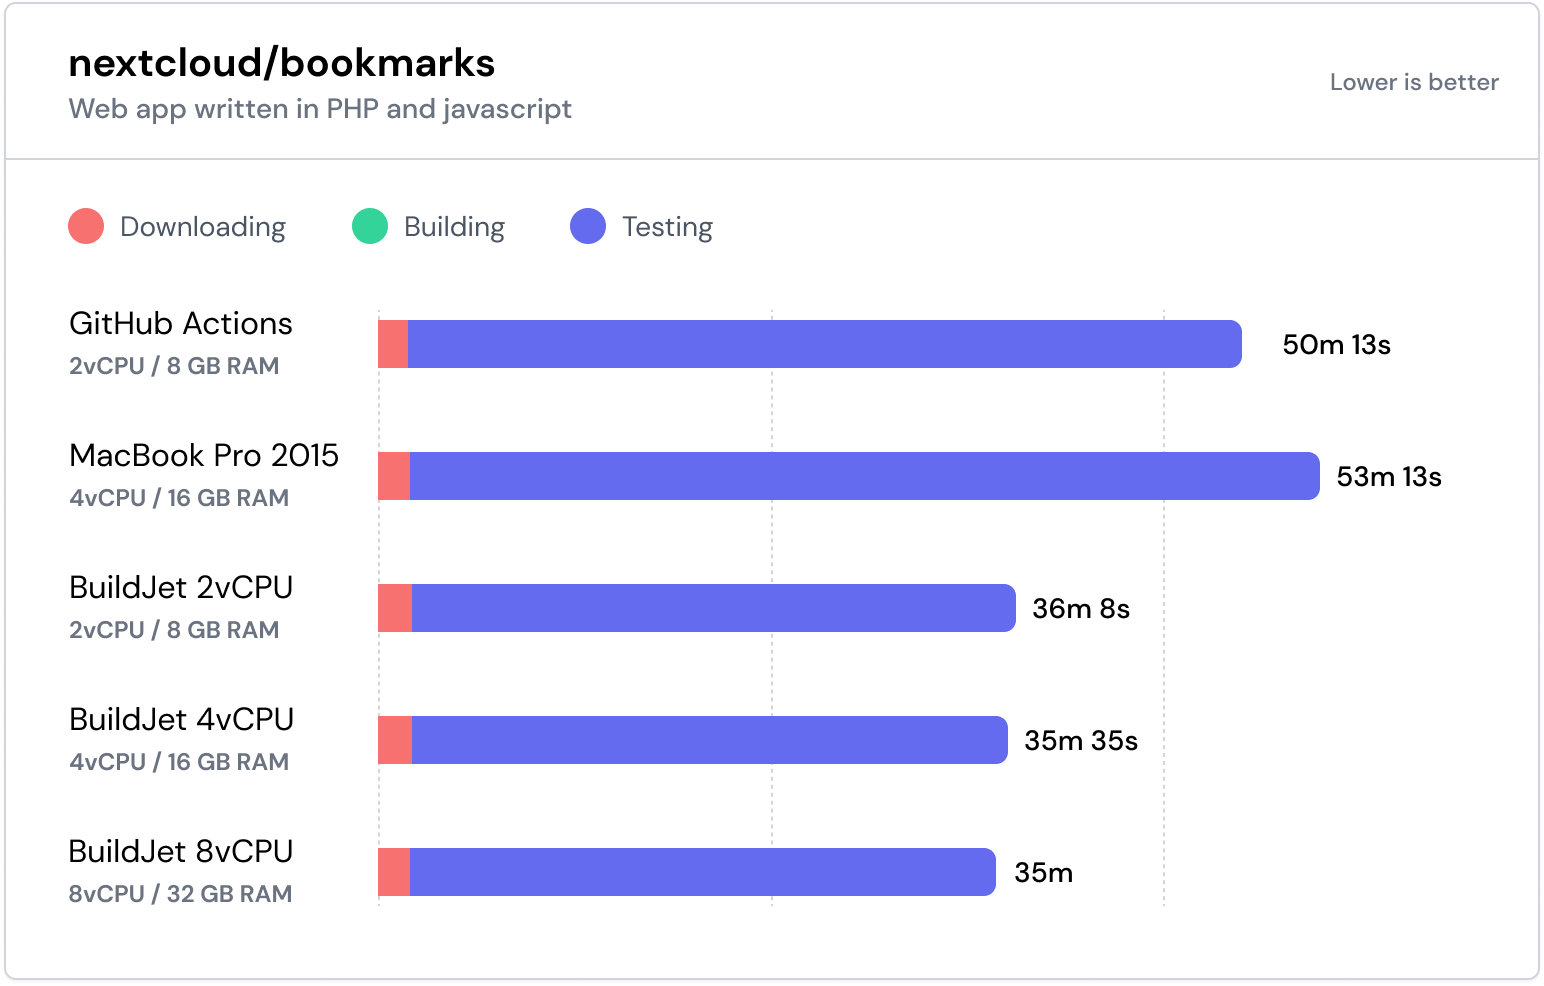 Main takeaways:
- The Selenium tests are single-threaded and only gain performance due to the single core speed improvement.
- Selenium tests are not parallelized, and only run sequentially. Thus, you don't see any speedups from more cores.
For more details check out the GitHub Actions CI run page.
Rust’s regex library
Rust build times are notoriously known to be slow, however, there are ways to minimize the slowdowns. Like many other languages, a proper amount of speedups requires CI speed is a dev team goal. 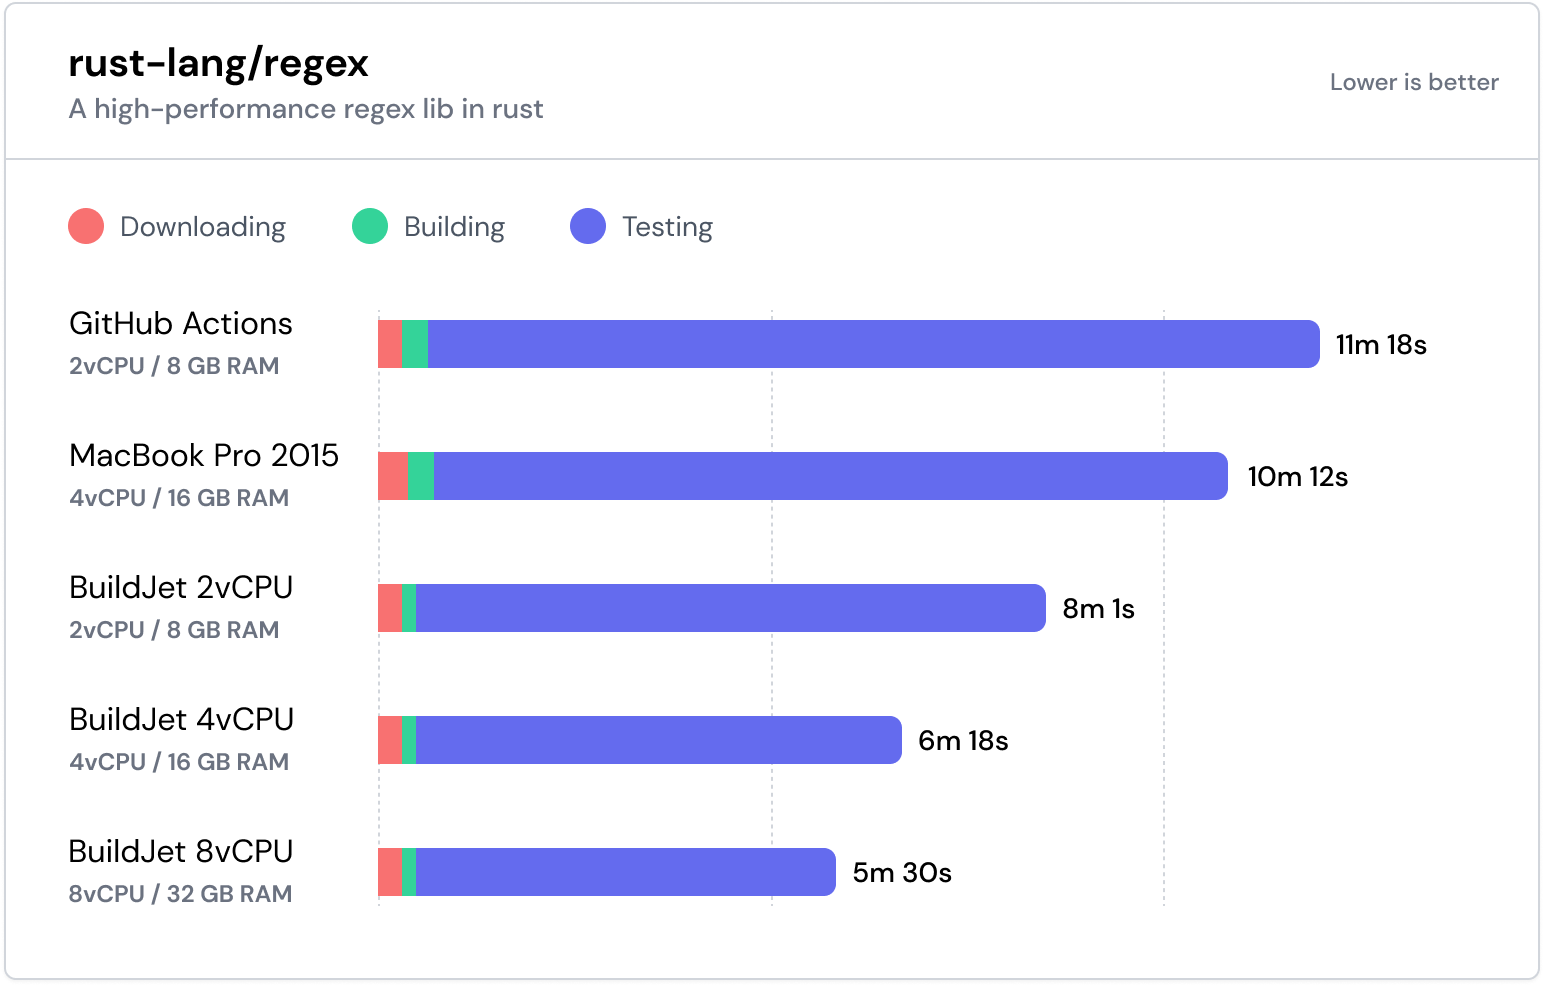
Main takeaways:
- A MacBook Pro from 2015 beats the GitHub Actions hardware
- Another clear example of a project that can utilize more available cores
For more details check out the GitHub Actions CI run page.
Occam's razor - a case for newer hardware
We decided to split the CI run into three parts: downloading, building, and testing. We did this mainly to highlight which part of the CI workflows can be addressed with faster hardware.
As seen in the charts above, time spent downloading does not decrease substantially with better hardware, mostly because it is network & IO-bound. The expensive parts of a CI workflow are during the build and test phase, where the workload mostly is CPU-bound and this is where good hardware counts.
Too big for speed
It is common practice for CI's to simply state the amount of vCPUs at the user's disposal. We do the same and find it generally to be a good abstraction. Cross-service comparison gets easier and the users don't need to dabble with the details. As this post is meant to explore the performance of GitHub Actions, we decided to dabble with the details. To do this we ran lscpu 50 times on the GitHub Actions hardware(source):
yml1name: Display information about GitHub Actions CPU architecture2on: push3jobs:4build:5strategy:6matrix:7runs-on: [ubuntu-latest]8name: [1...50]9name: Display lscpu - ${{matrix.name}}10runs-on: ${{matrix.runs-on}}11steps:12- name: Run lscpu13run: lscpu
After running the above workflow and cross-pollinating it with cpubenchmark data, we got the following results: 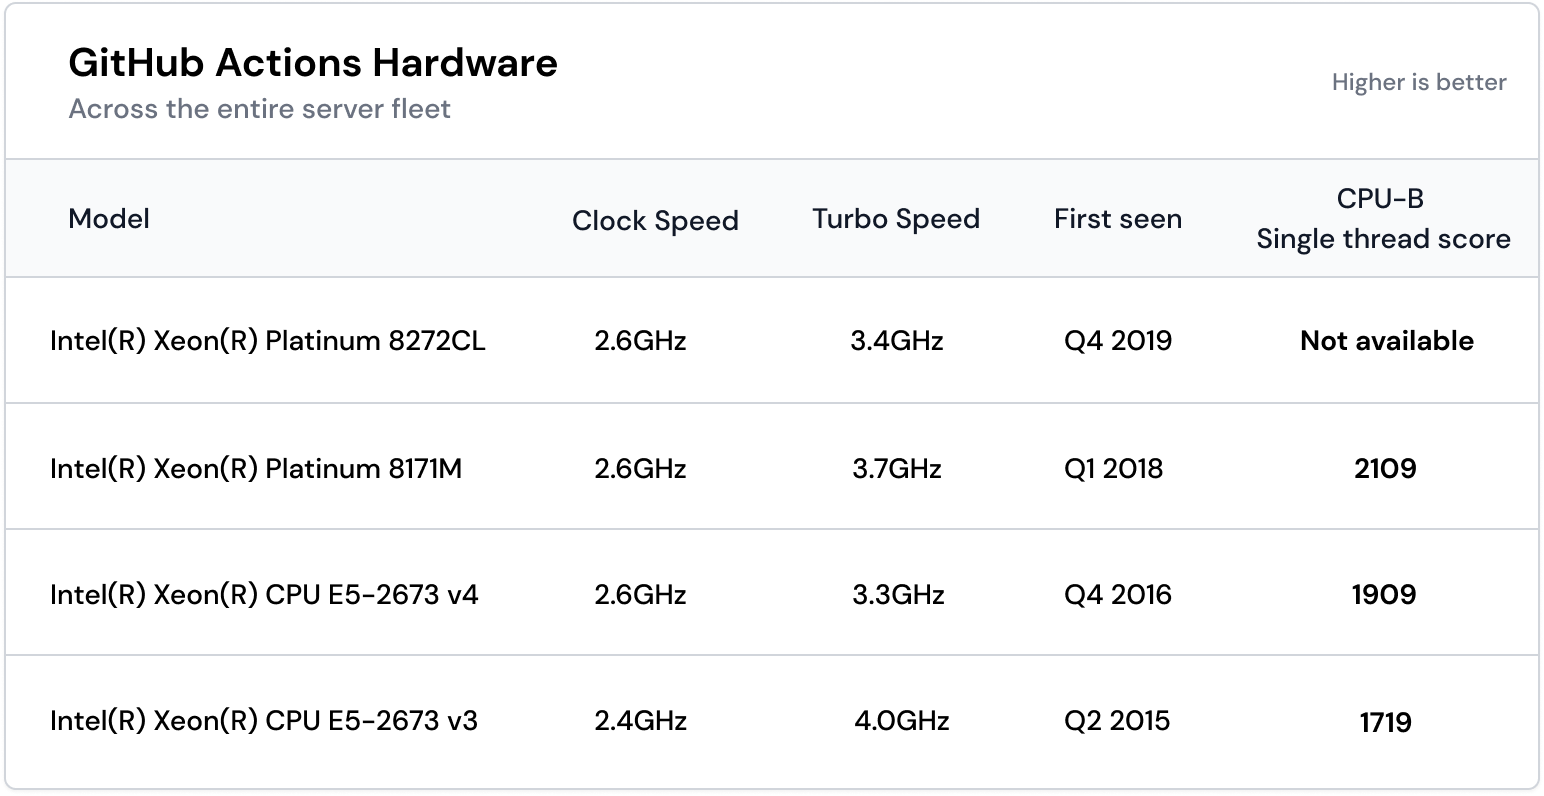 Looking at the GitHub hardware table we can extract a few things:
- If you're unlucky, GitHub Actions runs your workflow with old hardware from 2015.
- One of the processors, the 8272CL (C = Cloud, L = Large memory) is only sold through OEM channels and we were not able to find a normalized benchmark for it, hence the lack of a single-thread score. Although we did find a benchmark for the newer and better 8275CL. It lands on an underwhelming 2375 single-thread score, so the 8272CL would likely score less than that.
- Low clock speed becomes a problem, especially in single-threaded workloads. However, the lack of a single-thread score could be mitigated by only offering it to projects that can and want to utilize many cores.
Comparing this to the BuildJet hardware:
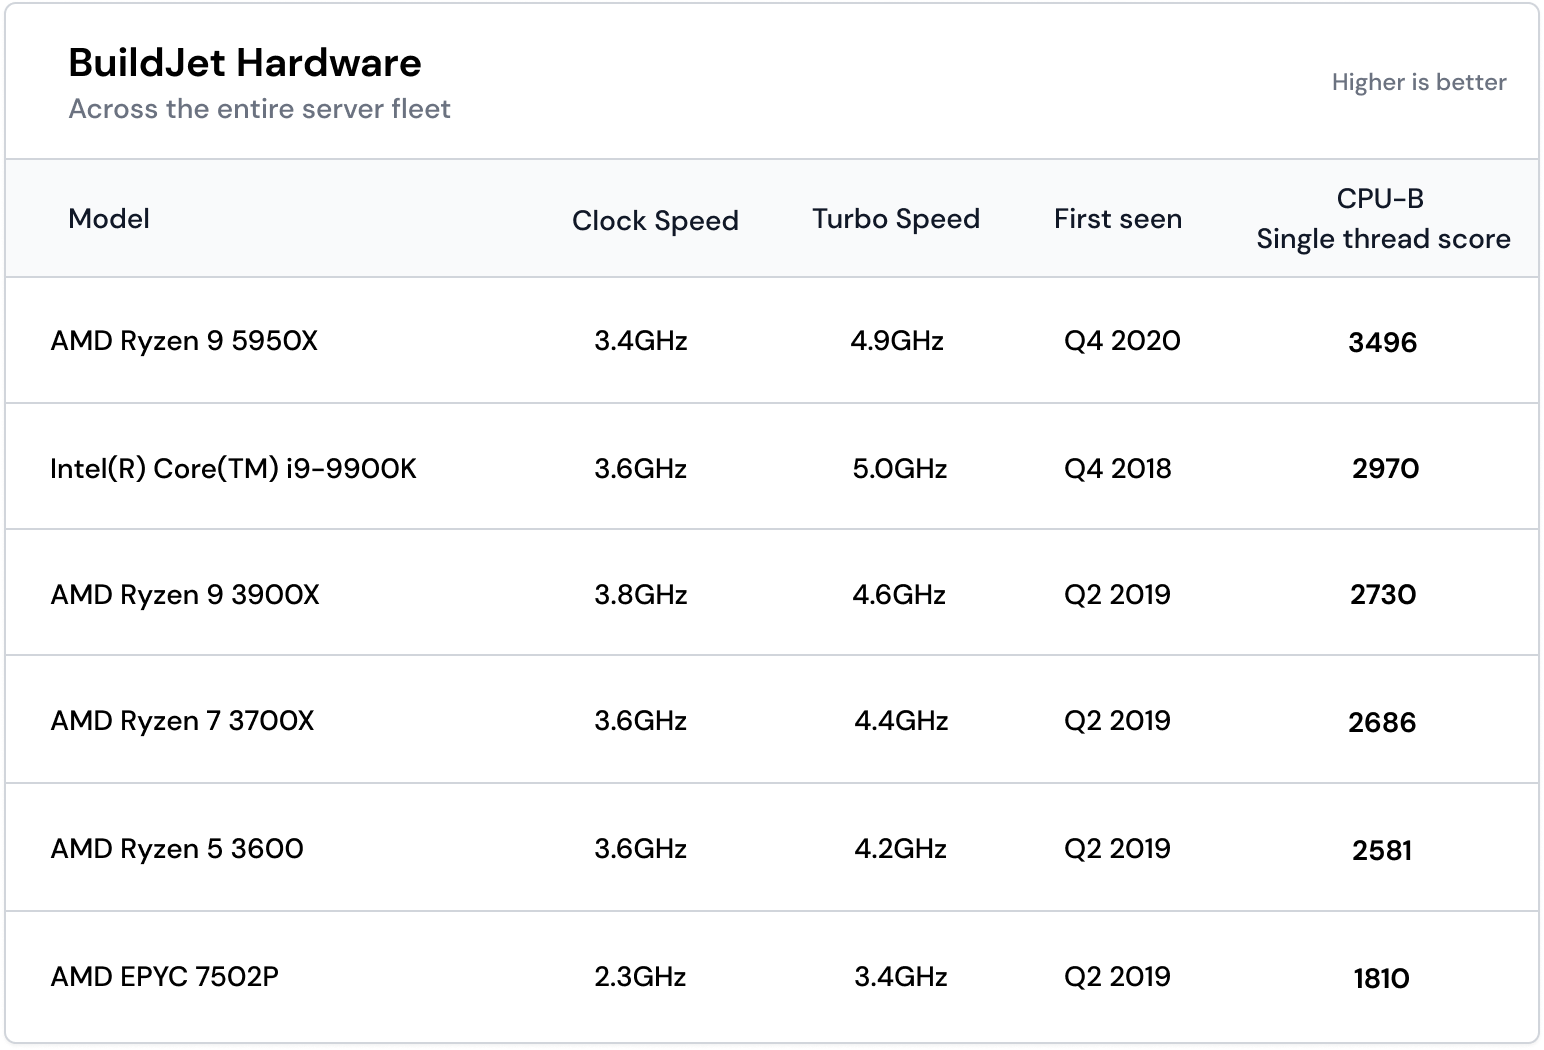 Looking at the BuildJet hardware table we can extract a few things:
- Our oldest hardware is quite new, Q4 2018.
- All our most used hardware has great performance. The only outlier is the AMD EPYC 7502P, which only gets used for workflows that require more than 16 vCPUs. This means that the value will be lower than the other hardware but recuperated by the fact that the workload most likely is multi-threaded.
- Our most used hardware has a clock speed higher than 3.4GHz, compared to Github's which maximum at 2.6GHz
Athletes in a contest of performance?
One might think we don't like GitHub Actions, but we do. We enjoy the close integration with GitHub and the free CI for public repositories. Nevertheless, we also see the value in offering newer and faster hardware to users that need it.
Our best theory in the case of GitHub Actions is that the slow hardware seems to be self-inflicted due to the close marriage to the Microsoft Azure cloud.
Painting with a larger brush, we also think the odd choice of hardware is a widespread problem in the entire CI ecosystem and not limited to GitHub Actions. We will handle the other CIs at a later stage, but for now, we will focus on GitHub Actions.
© 2026 BuildJet, Inc. - All rights reserved.
BuildJet has no affiliation with GitHub, Inc. or any of its parent or subsidiary companies and/or affiliates.